23.10.2026 14:13
In two separate election polls conducted by Gündemar and ORC, in one the New Party came out on top with 30.64%, while in the other the AK Party came first with 34.9%; the large differences in vote shares between the two studies raised questions in public opinion.
The latest election results published by two different polling companies conducting public opinion research drew attention with marked differences in political parties' vote shares. In the data from Gündemar Research and ORC Research, the gap between the vote shares of the parties that came first as well as other political structures confused the public.
YENİ PARTİ LEADS IN GÜNDEMAR'S POLL
In the 'Turkey Agenda Survey' conducted by Gündemar Research Consultancy on September 23-30, 2026, with 2,400 participants in 60 provinces, the table formed as follows after undecided voters were distributed:
- 1. Yeni Parti: 30.64% (+3.69 increase)
- 2. AK Parti: 28.24% (-0.14 decrease)
- 3. İYİ Parti: 7.77%
- 4. DEM Parti: 7.63%
- 5. Zafer Partisi: 5.81%
- 6. MHP: 5.46%
- 7. Other: 3.88%
- 8. CHP: 3.63% (-1.36 decrease)
- 9. Anahtar Parti: 2.83%
- 10. Yeniden Refah Partisi: 2.51%
- 11. TİP: 1.60%
AK PARTİ AT THE TOP IN ORC'S OCTOBER POLL
In the 'If There Were a General Election This Sunday' survey conducted by RC Research Company on October 17-19, 2026, with 3,900 people in 26 provinces, the table was seen to follow a quite different course:
- 1. AK Parti: 34.9%
- 2. Yeni Parti: 18.2%
- 3. CHP: 9.2%
- 4. MHP: 8.9%
- 5. DEM Parti: 8.6%
- 6. İYİ Parti: 7.2%
- 7. Zafer Partisi: 2.8%
- 8. Yeniden Refah Partisi: 2.4%
- 9. Büyük Birlik Partisi (BBP): 1.8%
- 10. Anahtar Parti: 1.5%
- 11. Other: 4.5%
DEVIATIONS IN THE DATA CAUSED CONFUSION
When the two surveys are compared, a large difference of approximately 6.7% in AK Parti's vote share and 12.4% in Yeni Parti's vote share stood out. The most striking gap occurred in CHP; CHP, which ranked eighth with 3.63% in Gündemar's data, placed third with 9.2% in ORC's data. Although the different survey dates, field sample sizes, and provincial distributions are cited as factors in these results, the resulting picture caused confusion among the public.
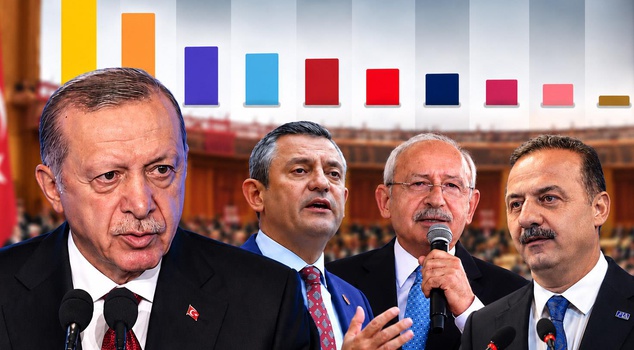
Here is the chart of the two companies' polls;